Have you ever wondered why your browser isn’t as fast as it used to be when it was new and fresh? Right, it’s the add-ons and plug-ins that you have been installing ever since. It’s a known fact that all extensions use memory, and some of them use more than the other. But which one? If this was Chrome, you could have fired open the built-in task manager and found out the answer right away. In Firefox, it’s not so easy. You could type about:memory in the address bar and get a pretty detailed report, but the information is presented in too haphazard a way to be of any meaningful use to the average user.
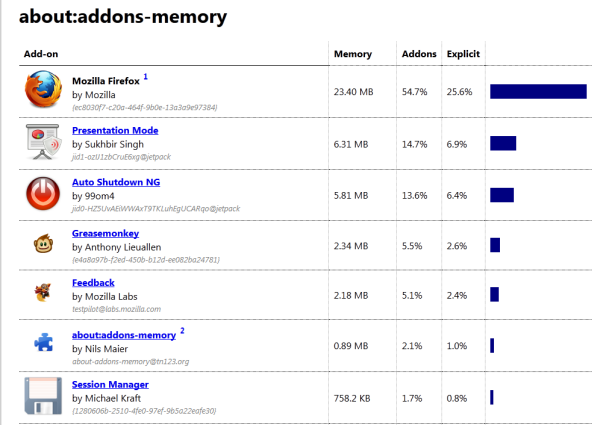
Instead of reporting memory consumption of each and every detail of the browser, a new extension called about:addons-memory reveals information about memory usage of only the extensions that are installed and enabled in your browser.
Install the add-on and then type “about:addons-memory” in Firefox’s address bar to open the report page.

Here you will see a list of all add-ons that are installed, arranged in the descending order of their current memory usage. Figures are given in absolute numbers as well as in percentage. The Explicit column shows what percentage of memory has been explicitly allocated by Firefox. The explicit measure is particularly useful when checking for memory leaks. There is also a small graph that lets you judge how a particular add-on compare with others.
The developer says that actual memory usage by the add-ons may be more than what is reported.
Many Add-ons, especially non-JetPack ones, may include static or dynamic overlays that may add scripts, DOM or styles directly to the browser. Such things cannot be distinguished from the browser itself and hence cannot be counted towards the add-on. As a result the actual add-on memory usage may be a lot higher than reported here!

Comments
Post a Comment