Firefox extension about:me – Browser usage statistics in graphs

about:me is like Google Analytics but for your browser. It’s a new addon for Firefox that displays your browser usage like sites visited, downloaded activity and other surfing habits in a colorful graphical format.

about:me tracks your daily usage of Firefox and displays the same in graphs revealing trends and patterns in your browsing and downloads history you never knew existed.

aboutme4

The addon draws graphs showing the websites you visit the most, including the individual pages you visit most within each top-level site. It also graphs your hourly browsing activity at various times of the day. There are also downloads statistics that illustrates the distribution of different types of files you download, as well as daily trends in your download activity.
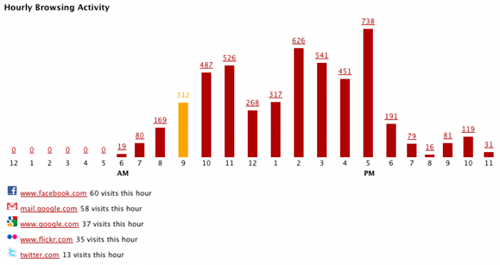
aboutme3

aboutme2

A number of other trend tracking features for about:me are on the pipeline. In coming weeks we can hope to see more statistics for:

  • Daily/monthly trends
  • Total usage over time
  • Average time on a page
  • How you get to pages (bookmark, link, etc)
  • Relationships between different pages (parent, etc.)
  • Novelty of Browsing (% first visits)
  • Recent activity
  • Sites visited multiple times but not recently
  • Trends over total history
  • Tabs Lifetime
  • Average number of tabs open
  • Information about current tabs
  • Top used bookmarks
  • Tag cloud for bookmark tags
  • Hourly/daily/monthly trends of bookmarks
  • IP address, Physical location, Internet connection, Network usage etc
  • Memory usage for different tabs/sites

Looks very exiting to me.

Comments

  1. I have installed this add on. But how to use it ? There is no clue either in your brief or in their home page. Please explain

    ReplyDelete
  2. And I found it by typing in the address bar. It is nice. But it did not show instant fundas which I visit once in every hour.

    ReplyDelete

Post a Comment

Popular posts from this blog

How to Record CPU and Memory Usage Over Time in Windows?

Whenever the computer is lagging or some application is taking too long to respond, we usually fire up task manager and look under the Performance tab or under Processes to check on processor utilization or the amount of free memory available. The task manager is ideal for real-time analysis of CPU and memory utilization. It even displays a short history of CPU utilization in the form of a graph. You get a small time-window, about 30 seconds or so, depending on how large the viewing area is.

How to Schedule Changes to Your Facebook Page Cover Photo

Facebook’s current layout, the so called Timeline, features a prominent, large cover photo that some people are using in a lot of different creative ways. Timeline is also available for Facebook Pages that people can use to promote their website or business or event. Although you can change the cover photo as often as you like, it’s meant to be static – something which you design and leave it for at least a few weeks or months like a redesigned website. However, there are times when you may want to change the cover photo frequently and periodically to match event dates or some special promotion that you are running or plan to run. So, here is how you can do that.

Diagram 101: Different Types of Diagrams and When To Use Them

Diagrams are a great way to visualize information and convey meaning. The problem is that there’s too many different types of diagrams, so it can be hard to know which ones you should use in any given situation. To help you out, we’ve created this diagram that lays out the 7 most common types of diagrams and when they’re best used: