Create beautiful charts online with ChartGizmo

Need to create a quick bar chart or pie diagram to mail it to a friend? Why not do it online? Before this online-application craziness took over, everything we did on our computer, we did it with applications installed on our own PCs. For years, I have been using Excel to create charts. Now with web services like ChartGizmo available, creating charts is a breeze. Not that it was any harder doing it with Excel, but it's definitely quicker.

ChartGizmo is absolutely free (but requires registration) and allows you to create various kinds of diagrams: Pie, Bar, Line, Ring, 3D Pie, 3D Bar, 3D Line, Scatter Plot etc. You can either manually enter the data or import it from an Excel sheet. Now you can't actually upload an Excel file, just select and copy the data and paste it into the data window. The charts are all customizable - everything from colors, to labels, chart orientation and sizes. A window on the right gives a live preview of the diagram even before you save it.

browser-usage

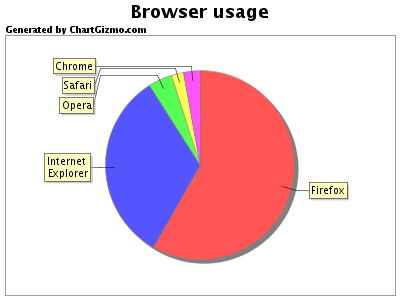
An example Pie-Chart showing browser usage trend among visitors to this site. The same data presented as a 3D bar diagram below.

GenerateChart2

ChartGizmo gives you multiple options to save and embed the chart in a web page. You get the chart in the standard PNG image format as well as in Flash, JavaScript and a Dynamic HTML format. All your charts are saved on your account and you can access them later at any time.

Comments

  1. I have used this online services and it's great. Recommended! Bye

    ReplyDelete

Post a Comment

Popular posts from this blog

How to Record CPU and Memory Usage Over Time in Windows?

Whenever the computer is lagging or some application is taking too long to respond, we usually fire up task manager and look under the Performance tab or under Processes to check on processor utilization or the amount of free memory available. The task manager is ideal for real-time analysis of CPU and memory utilization. It even displays a short history of CPU utilization in the form of a graph. You get a small time-window, about 30 seconds or so, depending on how large the viewing area is.

How to Schedule Changes to Your Facebook Page Cover Photo

Facebook’s current layout, the so called Timeline, features a prominent, large cover photo that some people are using in a lot of different creative ways. Timeline is also available for Facebook Pages that people can use to promote their website or business or event. Although you can change the cover photo as often as you like, it’s meant to be static – something which you design and leave it for at least a few weeks or months like a redesigned website. However, there are times when you may want to change the cover photo frequently and periodically to match event dates or some special promotion that you are running or plan to run. So, here is how you can do that.

Diagram 101: Different Types of Diagrams and When To Use Them

Diagrams are a great way to visualize information and convey meaning. The problem is that there’s too many different types of diagrams, so it can be hard to know which ones you should use in any given situation. To help you out, we’ve created this diagram that lays out the 7 most common types of diagrams and when they’re best used: